Reference
Charts and tables
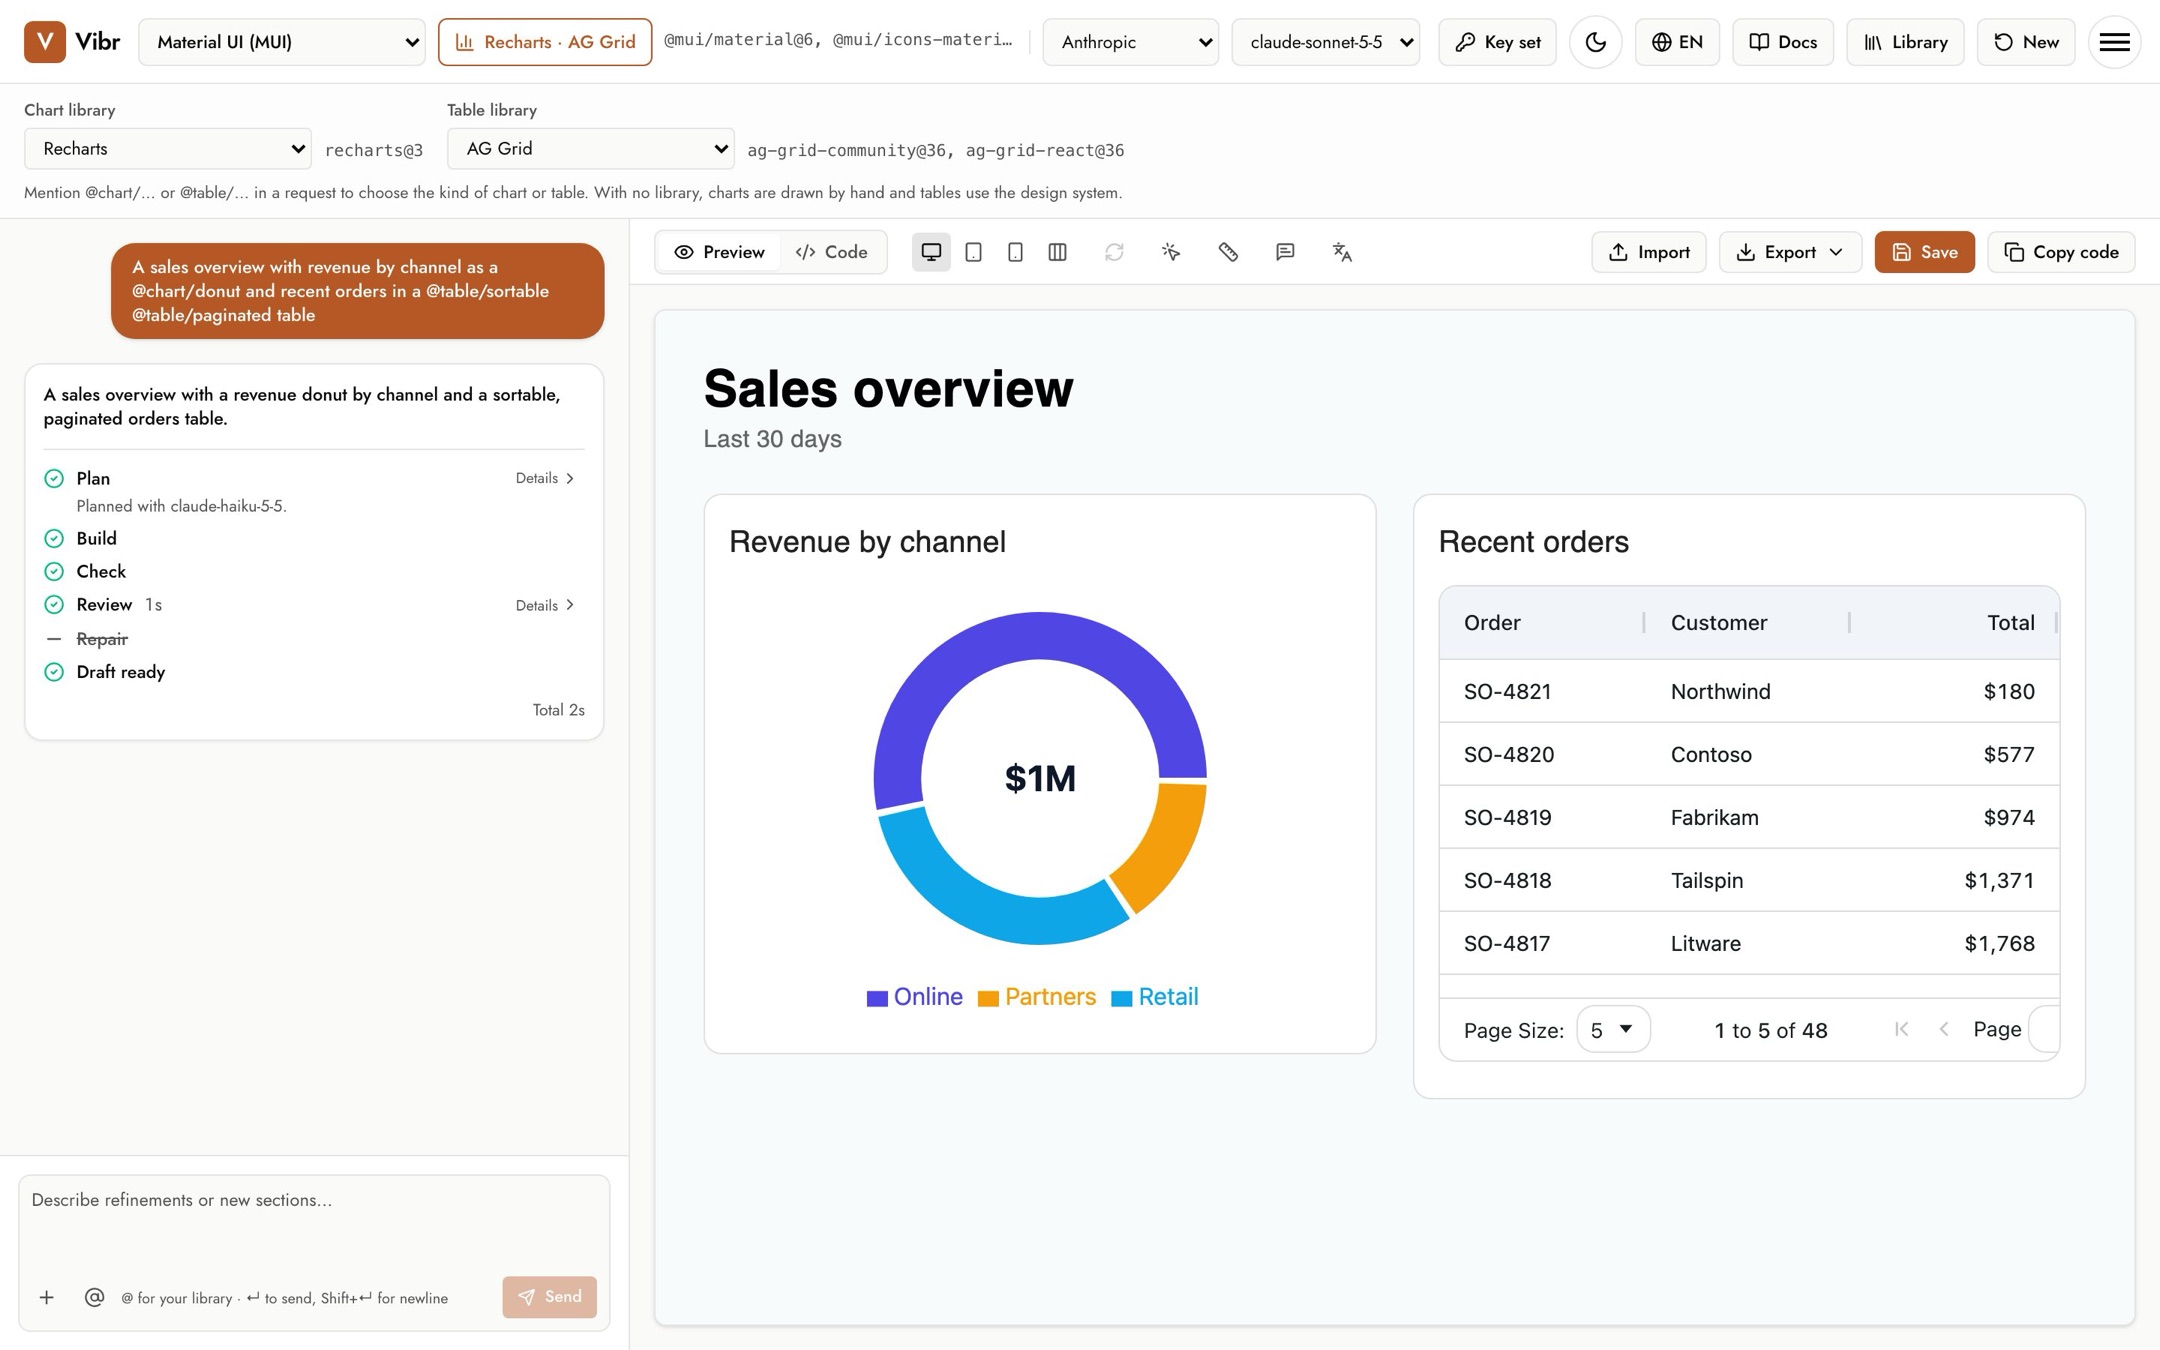
Pick a chart library and a table library for your drafts, and ask for the chart or table you want with @chart and @table mentions.
Choose a chart library and a table library to go with your design system, and every chart and data table in your drafts is built with them. Select Charts and tables beside the Design system picker, then pick one of each, or Custom npm package… for any other.
Choose your libraries
| Library | For | Packages |
|---|---|---|
| Recharts | Charts | recharts@3 |
| Apache ECharts | Charts | echarts@6, echarts-for-react@3 |
| Chart.js | Charts | chart.js@4, react-chartjs-2@5 |
| Victory | Charts | victory@37 |
| MUI X Charts | Charts | @mui/x-charts@9 |
| TanStack Table | Tables | @tanstack/react-table@8, @tanstack/react-virtual@3 |
| AG Grid | Tables | ag-grid-community@36, ag-grid-react@36 |
| MUI X Data Grid | Tables | @mui/x-data-grid@9 |
| React Data Grid | Tables | react-data-grid@7 (beta) |
The choice is saved with each prototype and goes with it into exports. Changing it doesn't start a new session, so you can add a chart library partway through. A custom package is checked on npm before building, like a custom design system.
Mention a chart or table
Then say what you want with a mention. Type @ and chart/ or table/ to see them all:
- Charts:
@chart/bar,@chart/stacked-bar,@chart/horizontal-bar,@chart/line,@chart/area,@chart/stacked-area,@chart/pie,@chart/donut,@chart/scatter,@chart/radar,@chart/heatmap,@chart/treemap,@chart/funnel,@chart/gauge,@chart/sparklineand@chart/combo(bars and a line). - Tables:
@table/sortable,@table/filterable,@table/paginated,@table/selectable,@table/editable,@table/grouped,@table/expandable,@table/pinned(a sticky header and first column),@table/virtualized(thousands of rows) and@table/resizable. Mention several for one table:@table/sortable @table/paginated.
Each mention tells the model which parts of your library build that chart or table. When the library doesn't have one, such as a heatmap in Recharts, or row grouping in the free edition of AG Grid, the model builds it another way in the same style.
Match your design
To match your design, mention a color theme in the same request: charts and tables take its colors and type in light and dark mode, and tables its corner radius and spacing too. With no library chosen, charts are drawn by hand as SVG and tables use your design system's own.